
As a DBA, you will be familiar with the scenario of an application being sourced from an external supplier. In this scenario, to try and improve performance is either to present your findings to the supplier and hope they make some changes (rare) or allow you to at least add/remove some indexes. In addition, the VM the apps run on is now chronically undersized due to the growth of the system over 5-10 years of neglect. Compounding matters is that the VM was set up by someone who put everything on one disk when installing SQL Server.
This blog post will explore turning dials on a system with a large overnight batch load that has an unacceptably long run time. We are not allowed to add indexes or change code.
Test Setup
This VM sits on my Rubble Box. The Rubble Box now runs Proxmox for virtualization.
VM
- 16 vCPU
- 8GB RAM
- SSD storage – ALL data, log and TempDB on one disk to simulate a poor setup.
- Samsung PM863a 3.84TB (old school)
SQL Server
- SQL Server 2025
- Developer Edition
- 17.0.4065.4
- MAXDOP set to 8
- CTFP set to 40
Workload
We are going to use Nick’s Gaming Emporium as our test suite (medium size at 300GB). This sample dataset has a stored procedure that builds our data warehouse schema that we can call (which calls other stored procedures).
USE [nge_medium]
GO
/****** Object:  StoredProcedure [batch].[usp_refresh_everything]    Script Date: 25/09/2026 09:40:06 ******/
SET ANSI_NULLS ON
GO
SET QUOTED_IDENTIFIER ON
GO

/* ---- the overnight batch: dims → facts → rollups, end to end ---- */
ALTER   PROCEDURE [batch].[usp_refresh_everything]
    @full BIT = 1
AS
BEGIN
    SET NOCOUNT ON;
    EXEC batch.usp_refresh_all_dimensions;
    IF @full = 1 EXEC batch.usp_drop_columnstore;    -- keep the big fact reload fast
    EXEC batch.usp_refresh_all_facts @full = @full;
    EXEC batch.usp_refresh_all_rollups;
    EXEC batch.usp_refresh_sales_wide @full = @full; -- CCI OBT
    EXEC batch.usp_build_columnstore;                -- (re)create the NCCIs
END
Control Run
Let’s trigger a run and see how long it takes:
sqlcmd -S LAB02PHUK,1433 -d nge_medium -E -p 1 -Q "SET STATISTICS TIME ON; EXEC batch.usp_refresh_everything @full = 1;"
First run finished in 12h 6m, so this is a long overnight batch. Let’s look at the waits:

Drilling into the numbers themselves:

My knee-jerk reaction is that our overnight batch process is fetching from disk on our 8GB VM hence the PAGEIOLATCH_SH waits (also have some Parallelism and BPSORT creeping in). Let’s check if that disk is performing properly just to cover it off (in case the disk is saturated/slow).
Looking at latency:

Some of these numbers are absolutely horrendous (>300ms). Note that all these volumes are on the same SSD.
Is the disk saturated bandwidth-wise?
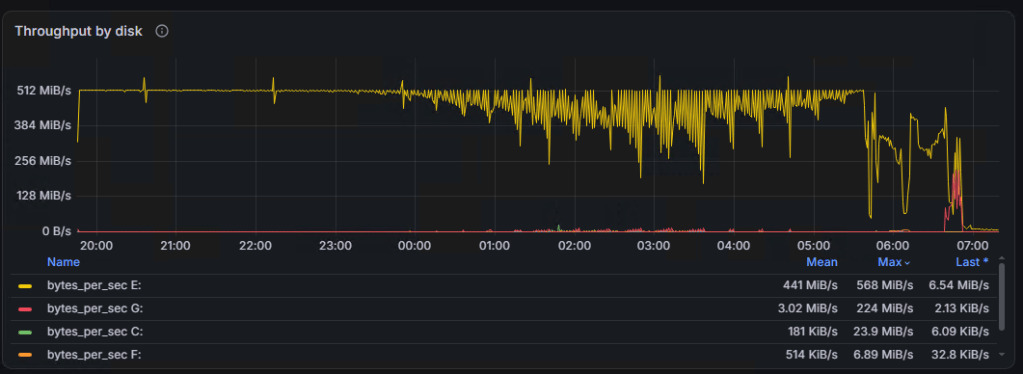
Looks like we are saturating the disk overnight (taps out over 500MB/s) with our massive batch process, which will explain the latency.
CPU for this workload was modest, so I am not worried right now about compute:

Making some changes
Without even looking at the queries/indexes (changing them is banned, remember), I am going to throw more memory at the issue. Consider this our first knob.
So, we are going to retest the big batch at 8GB, 16GB, 32GB, 64GB and 128GB, respectively. I usually do each run 5 times, but this amount of testing would be time-consuming for the sake of this blog post. Therefore, I only tested each run once. Every run produced identical row counts with the data being identical.
I also went with Microsoft’s 75% memory recommendation.
Here are the results:

As we can see, once the working set fits in memory (128GB), the run times tumble for our big batch to under 3 hours. 16GB and 32GB barely moved the needle.
Let’s check the waits:
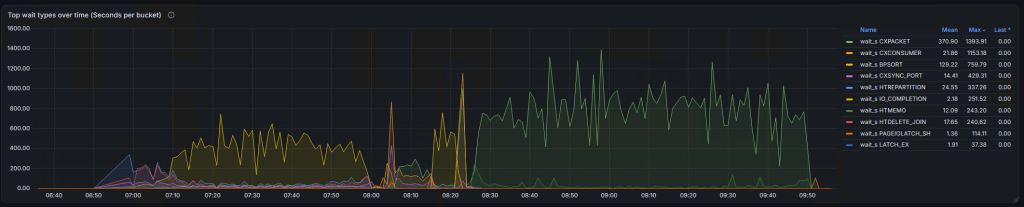
Our waits are completely transformed. This is because we are lucky in that we can now fit whatever it needs to fit in memory to eliminate the constant disk access. PAGEIOLATCH_SH is still there but reduced massively and almost out the top ten.

Comparing the reads during the runs yields the following results:

Finally, is our disk still getting slammed?

Apart from a few peaks, we have smashed out most of the latency, and we are back to more palatable figures.
How does bandwidth look?

We are using very little disk as a result of extra memory headroom.
Just as a sanity check, are we using more CPU now that we are not waiting on storage?

The answer is yes, a little, but SQL Server is now doing stuff which is what we want.
Is there anything else to tune?
In a real prod environment, I would be leaving this to bake in for a while and see if this batch continues to perform under 3 hours. There could be other databases living on this host with sporadic and random workloads that could spoil the day by edging out our working set. However, for the sake of this blog post let’s see what happens if we trim parallelism. We had lots of parallelism waits which were not causing a problem but let’s see what happens if we play with MAXDOP, since we are here…
The second knob is therefore going to be MAXDOP. DOP was set to 8 on this server so here are the results of 16, 8, 4, 2 and 1, respectively.

Lowering it only made the runtimes longer, and raising it to 16 made no difference at all. It did reduce the parallelism waits, but that was the only thing it improved.

Conclusion
We were handed a slow overnight batch with the usual rules: no code changes and no new indexes. The knobs were all we had.
Memory was the knob that mattered. Going from 8GB to 32GB barely moved the needle (about 25 minutes off a 12 hour run), but once the working set fitted in memory at 128GB, the batch dropped to under 3 hours. Physical reads fell by over 99%, and the disk that was being hammered at 500MB/s went quiet.
MAXDOP was not the lever. Lowering it only made the batch slower, and raising it to 16 changed nothing. The existing setting of 8 was already right, parallelism waits and all.
Two takeaways. First, memory behaves like a threshold, not a slope. If adding RAM doesn’t help, it doesn’t necessarily mean memory isn’t the problem; you may not have added enough yet. Second, don’t lower MAXDOP just to make parallelism waits go away. They may be perfectly normal for your workload, so do the legwork and investigate them properly. Ours looked alarming, but reducing them only cost us time.
None of this replaces fixing the code or the storage layout. But when the supplier won’t budge, one well-tested knob gave us over 9 hours back every night. It is also worth mentioning that it isn’t as simple as adding some more memory to a VM if you are in the cloud, as it will need a SKU upgrade costing $$$.
But were memory and MAXDOP really the only knobs we had? Rebuilding indexes is routine maintenance in a lot of shops, and nothing in our rules says we can’t rebuild them with page compression. On paper, smaller data should mean fewer reads and a working set that fits in far less memory. In part two, I will turn the compression knob and see whether it lives up to the hype.
Resources
https://github.com/ukhype83-dev/nicks-gaming-emporium/tree/main